Director, Seasonal Forecasting
Atmospheric and Environmental Research
JANUS Research Group
July 15, 2026
Summary
The Arctic Oscillation (AO) is currently neutral as pressure/geopotential height anomalies across the Arctic are currently mostly mixed and the AO is predicted to remain mostly mixed to slightly negative the next two weeks as pressure/geopotential height anomalies are predicted to remain mixed to slightly negative the next two weeks. The North Atlantic Oscillation (NAO) is currently positive with negative pressure/geopotential height anomalies across Greenland, and the NAO is predicted to trend negative the next week as pressure/geopotential height anomalies are predicted to turn positive across Greenland the next week.
Currently troughing/negative geopotential height anomalies across Greenland will favor ridging/positive geopotential height anomalies to dominate Europe this week, however next week with the return of ridging across Greenland troughing will deepen across Europe centered on Eastern Europe. This pattern will favor normal to above normal temperatures across Europe including the United Kingdom (UK) this week but by next week normal to below normal temperatures will overspread Central and especially Eastern Europe while above normal temperatures will persist in Western Europe including the UK.
The predicted pattern across Asia this week is ridging/positive geopotential height anomalies centered across Southern Asia and Eastern Siberia with troughing/negative geopotential height anomalies across Northern Asia. Then next week ridging will strengthen centered on the Urals supporting deepening troughing in Siberia and Northeast Asia. This pattern favors mostly normal to above normal temperatures across Central Asia and Eastern Siberia with normal to below normal temperatures across Northern and Northeast Asia while next week temperatures will turn normal to above normal in Western Russia while persisting in Central Asia with normal to below normal temperatures in Western and Central Siberia and into Northeast Asia.
Over the coming week the predicted atmospheric pattern across North America is a quasi-omega block pattern with ridging/positive geopotential height anomalies across western North America bookended by troughing/negative geopotential height anomalies centered in Alaska and Quebec with weaker troughing in the Southern Plains. This patten will support this week widespread normal to above normal temperatures across much of Canada and the US with normal to below normal temperatures across Alaska, Quebec and centered on Texas. Then next week the biggest change will be in the Eastern US as cooler temperatures slide south out of Quebec across the Eastern US.
Plenty of heat domes roaming across the Northern Hemisphere (NH) in full summer mode but still some surprises. My thoughts below.
The next scheduled blog is probably the first week of August due to travel and personal holidays.
Plain Language Summary
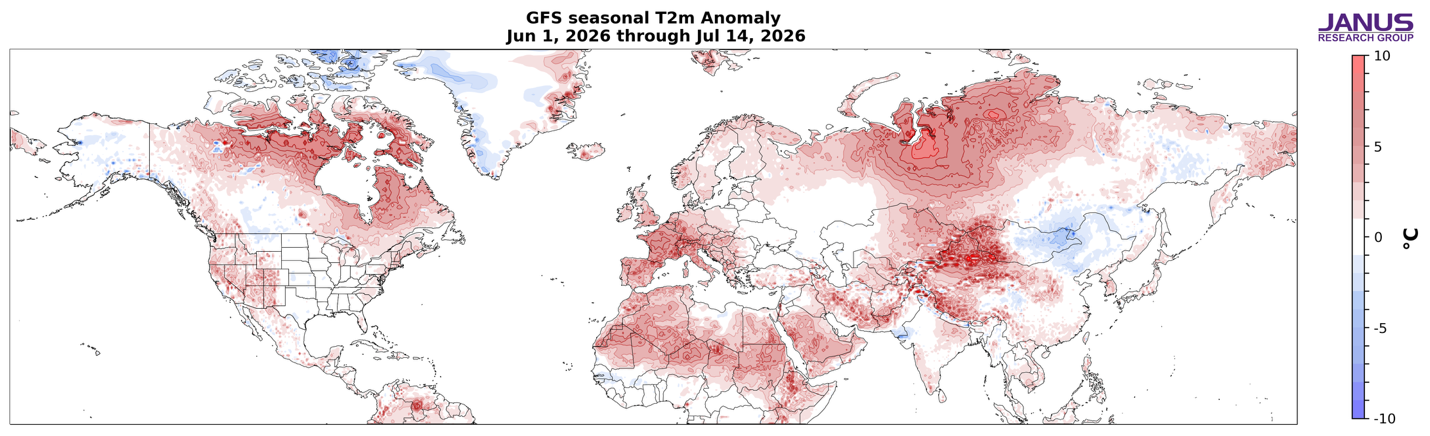
The beginning of summer can be summed up as heat domes across Western Europe, Western Siberia and Eastern Canada favoring some relatively cool temperatures at lower latitudes in parts of Eastern Europe, Northeast Asia, Southcentral Canada and the Central US (see Figure). The forecast features a westward retrogression of the heat domes across Europe, Western Siberia and Eastern Canada supporting relatively cool temperatures in Eastern Europe, Northeastern Asia and probably the biggest change - in Eastern Canada (see Figures 3, 6 and 9).
Figure.
Estimate of the observed surface temperatures (°C; shading) from 01 Jun to 24 Jun 2026 based on GFS initializations and the GFS forecast from the 14 Jul 2026 run.
Impacts
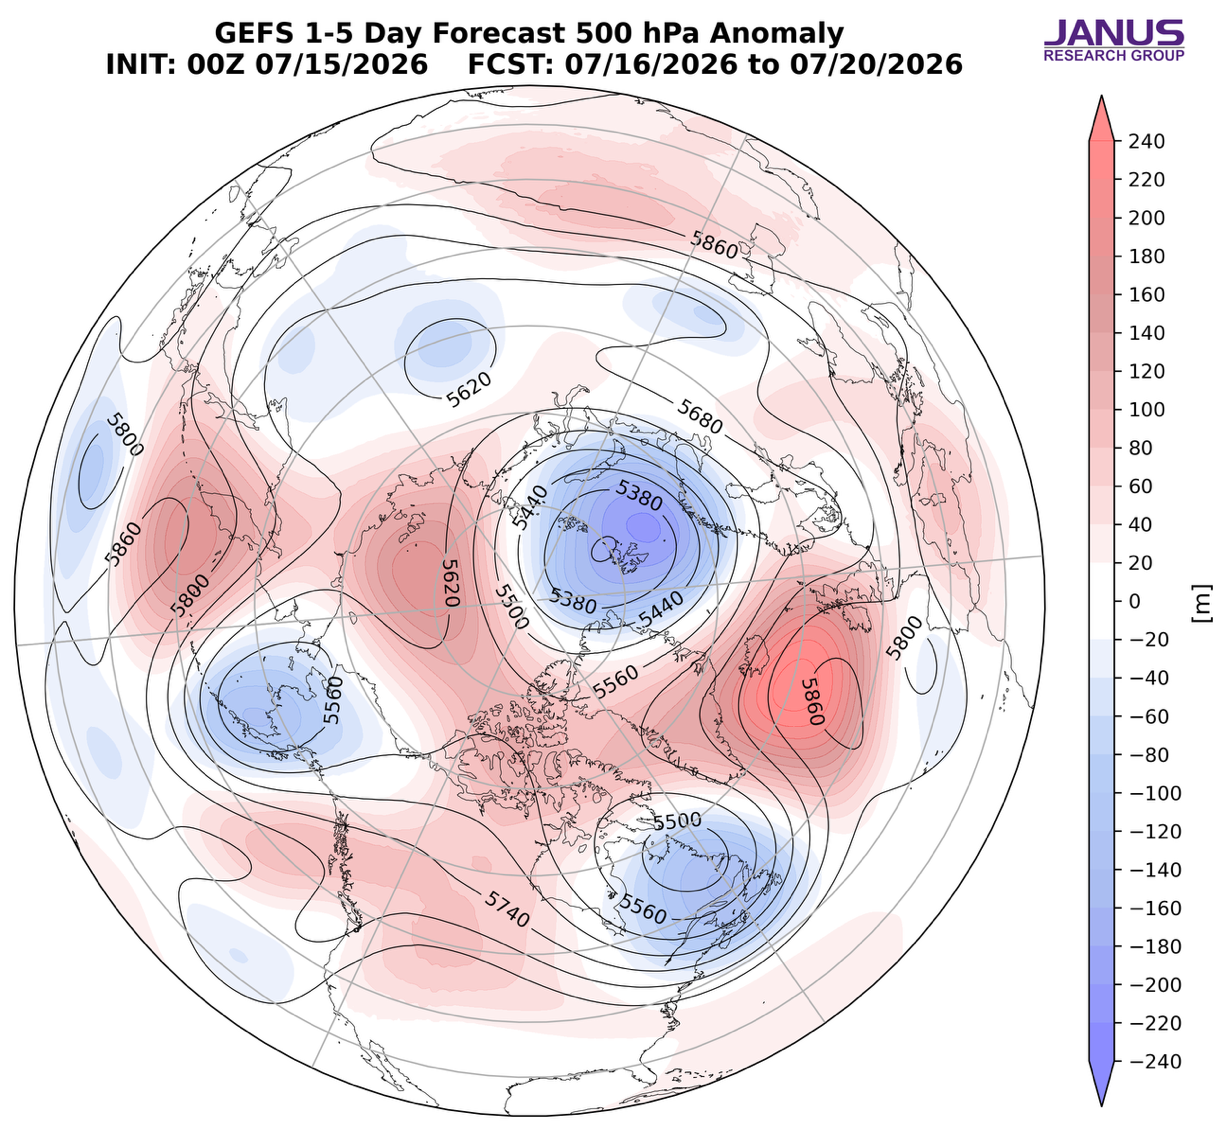
As usual I begin the discussion with a look at the two-week forecast of the mid-tropospheric circulation animation in Figure I. As is often the case, and in summer more than winter, we can easily discern a general pattern of low pressure in the Arctic centered right over the North Pole encircled or surrounded by bubbles of high-pressure ridging centered mostly near 60°N and could be described as heat domes.
There are three main regions of high-pressure ridging with one center over the North Atlantic, another near Eastern Siberia and the third over Western Canada. These three features strongly contribute to widespread warmth across the northern continents (see Figures 3, 6 and 9). Though these high-pressure centers are also helping to push south into the mid-latitudes relatively cool temperatures downstream into Eastern Europe, Northeast Asia and Eastern Canada and eventually the Eastern US (see Figures 3 and 6).
Figure i.
Initialized 500 mb geopotential heights (dam; contours) and decameter anomalies (dam; shading) across the Northern Hemisphere for 15 July 2026 and forecasted from 26 July to 30 July 2026. The forecasts are from the 00Z 15 July 2026 GFS model.
With half the summer in the books, looking once again at the NH temperature anomalies so far this summer (see above Figure), I think the general pattern could in the end closely match the predicted summer temperature pattern across North America, Europe and Asia. Maybe the biggest miss would be the predicted cool temperatures in Western Russia that might end up further west in Eastern Europe instead but not yet set in stone. Certainly better than the C3S forecast that had the European heat centered in Eastern Europe. The heat looks almost certainly to be focused on Western Europe, where the hot, dry pattern has been impressive for its magnitude and persistence. Though based on the latest forecasts, the worst might be over as the heat dome drifts west towards Greenland, but not a given.
I think overall the model is doing a pretty good job for Asia so far, with the heat focused on Western Siberia and closer to seasonable in Northeast Asia, though the observations are cooler than the forecast for the first half of the summer. Also the forecast is looking solid for North America with widespread warmth except for cooler than normal temperatures in the center of North America and into the Southeastern US. However the forecast for Alaska might be too warm.
The Eastern US has had a mix summer with some pleasant weather interspersed with high heat. I guess a typical summer overall with close to seasonable temperatures. I do think there is a good chance the worst of the heat is behind the Northeastern US, but we still have August, so hard to get too comfortable with such a prediction.
El Niño has garnered a lot of attention, and this looks to be a large event for the reminder of the year. El Niño is related to cooler, wetter than normal summers in the US while La Niña warmer drier summers. I think the summer of 1988 cemented the impression that La Niñas support continental heat domes, heat and drought for the US. But looking at the temperature pattern across the US this summer so far it seems to be just the pattern that recent summers have settled in to regardless of the phase of ENSO. So far, in my opinion it is hard to observe the impact of El Niño on US weather just yet. Looking ahead to winter it is also my impression most long-range forecasters will hedge mild based on the strong El Niño. It is an unusual situation with a negative Pacific Decadal Oscillation (PDO) rather than a positive PDO as has been the case until now. I think a negative PDO tends to favor milder winter weather in the Eastern US. Not sure the negative PDO strengthens the case for a colder winter in the Eastern US than the super El Niño suggests, but in my opinion, it does at least add uncertainty to the forecast.
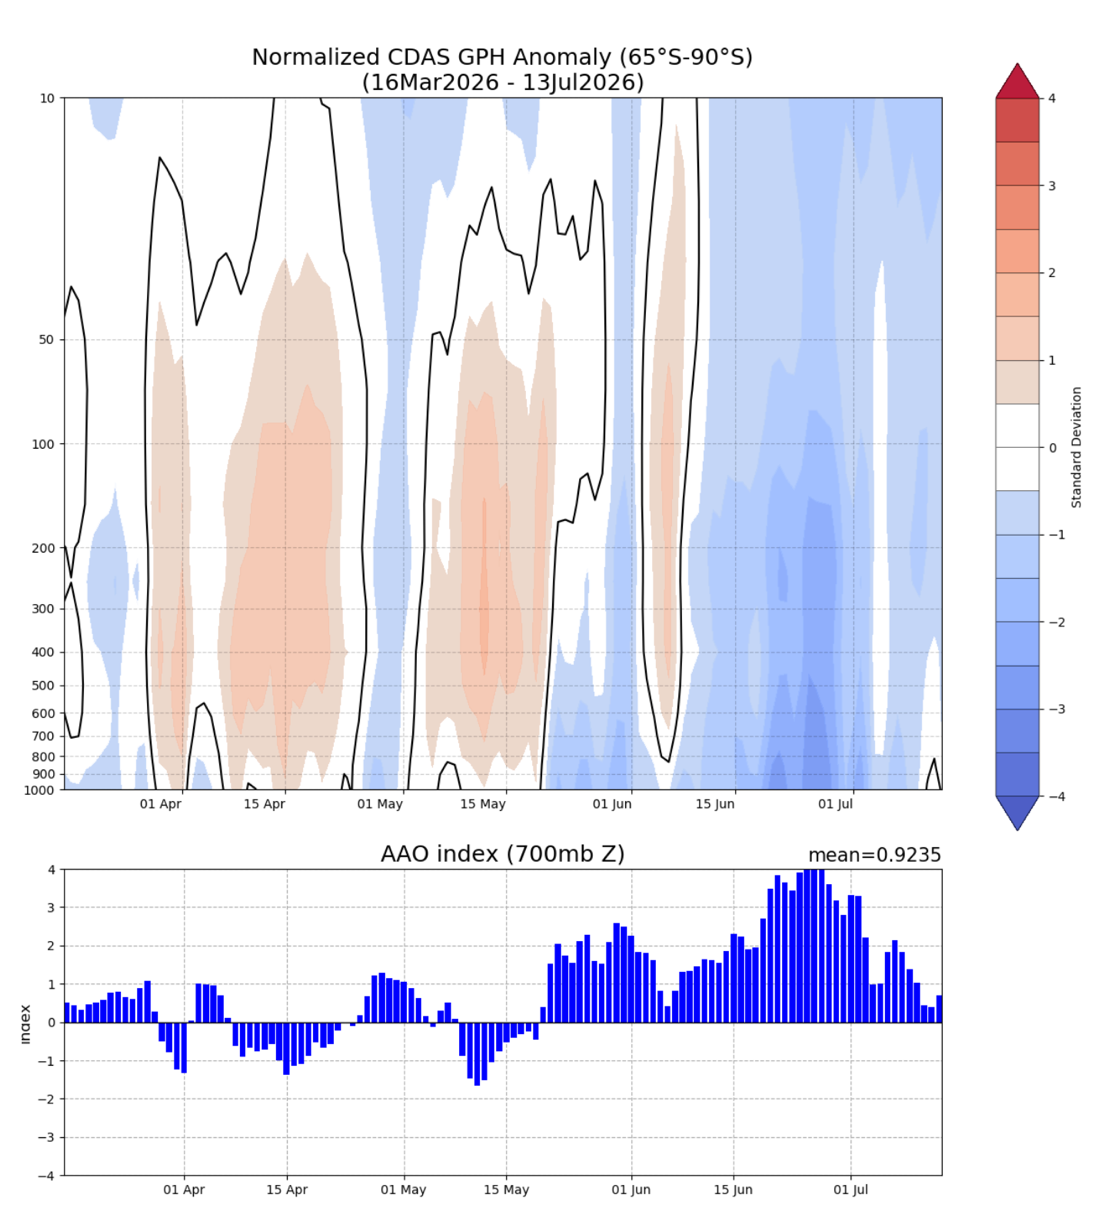
If you need a polar vortex fix here in mid-summer, it does exist in the Southern Hemisphere currently. Looking at the polar cap geopotential height anomalies (PCHs) for the Southern Hemisphere (SH) produced by CPC in Figure ii, cold/negative PCHs dominate throughout the atmospheric column but especially in the lower troposphere with a strongly positive Antarctic oscillation (AAO). This likely supported cold around the South Pole and milder conditions at lower latitudes. I haven’t heard of any news stories of unusual winter weather in the SH, which would be consistent with the strongly positive AAO. But I see the forecast is for the AAO to drop precipitously, so that could change. If that were to foreshadow the upcoming NH winter that would suggest an overall mild with a less snowy winter, but I have had a hard time seeing much predictive potential in looking at the polar vortex in the opposite pole one season ahead. Otherwise, the South Pole polar vortex seems to be having an unremarkable season so far.
Figure ii.
Observed daily polar cap height (i.e., area-averaged geopotential heights poleward of 65°S) standardized anomalies (top) and the AAO index (bottom). Plot taken from https://www.cpc.ncep.noaa.gov/products/precip/CWlink/daily_ao_index/hgt.aao.shtml
Finally we have a timely new paper out on heat extremes and Arctic change, given how heat has dominated the weather headlines this summer:
https://www.nature.com/articles/s41598-026-60243-0_reference.pdf
Jennifer Francis who regularly reads the blog is the first author. I think that it is an interesting paper but can’t claim to be unprejudiced towards the study.
Near Term
This Week
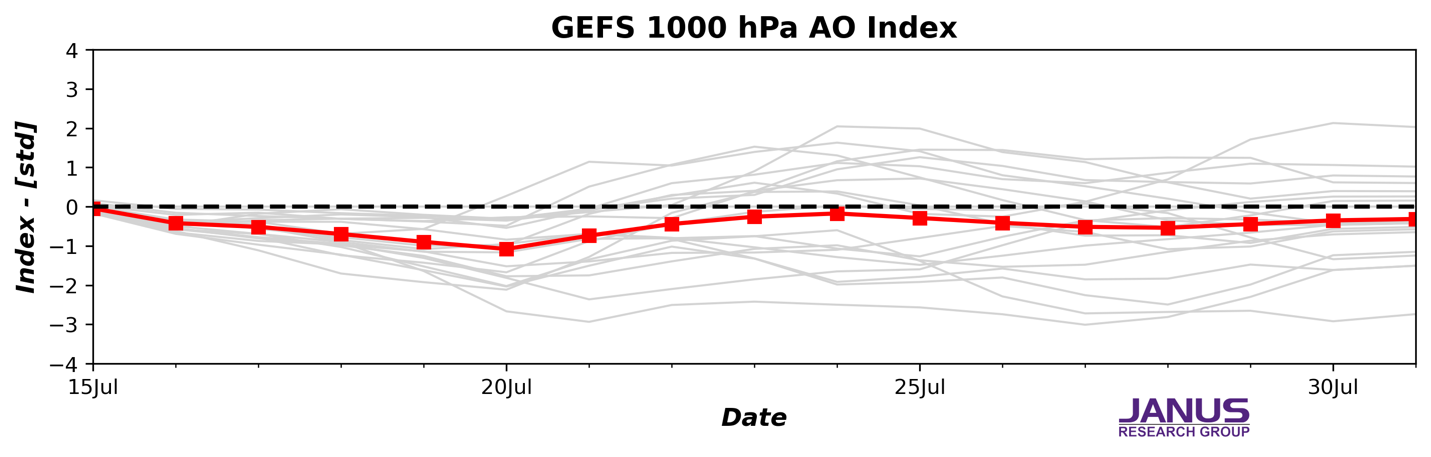
The AO is predicted to be neutral to negative this week (Figure 1) with mostly mixed to positive geopotential height anomalies currently across the Arctic and mixed geopotential height anomalies across the mid-latitudes of the NH (Figure 2). With predicted increasingly positive geopotential height anomalies across Greenland (Figure 2), the NAO is predicted to be trend negative this week.
Figure 1.
The predicted daily-mean AO at 1000 hPa from the 00Z 15 Jul 2026 GFS ensemble. Gray lines indicate the AO index from each individual ensemble member, with the ensemble mean AO index given by the red line with squares.
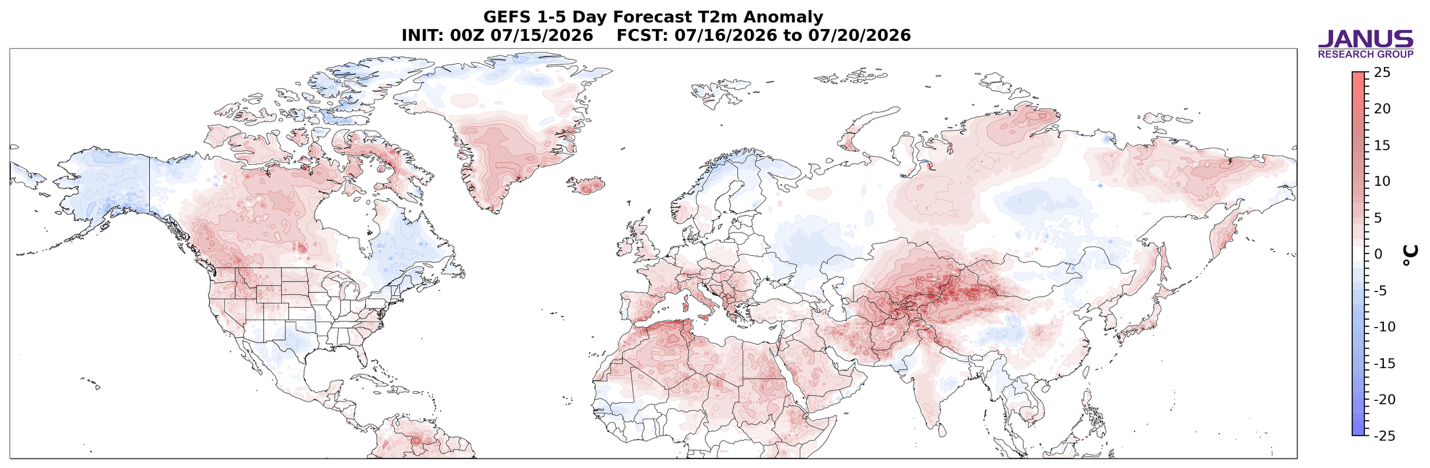
Strengthening ridging/positive geopotential height anomalies across Greenland will support deepening troughing/negative geopotential height anomalies across Eastern Europe while ridging persists across Western and Southern Europe this week (Figure 2). This pattern will support normal to above normal temperatures across Western and Southern Europe including the UK with normal to below normal temperatures across Northern and Eastern Europe this week (Figure 3). This week the general pattern across Asia is ridging/positive geopotential height anomalies across Southern Asia and Eastern Siberia with troughing/negative geopotential height anomalies across Northern and Eastern Asia this week (Figure 2). This pattern favors widespread normal to above normal temperatures across much of Southern and especially Central Asia and Eastern Siberia with normal to below normal temperatures across Northern and Eastern Asia this week (Figure 3).
Figure 2.
Forecasted average 500 mb geopotential heights (dam; contours) and geopotential height anomalies (m; shading) across the Northern Hemisphere from 16 Jul 2026 to 20 Jul 2026. The forecasts are from the 00Z 15 Jul 2026 GFS ensemble.
The predicted pattern across North America this week is ridging/positive geopotential height anomalies centered over western North America with troughing/negative geopotential height anomalies over Alaska and Quebec and some weak troughing centered over Texas this week (Figure 2). This patten will favor normal to below normal temperatures across Alaska, Quebec into New England and the US Southern Plains with normal to above normal temperatures across much of Canada, the Western and Southeastern US this week (Figure 3).
Figure 3.
Forecasted surface temperature anomalies (°C; shading) from 16 Jul 2026 to 20 Jul 2026. The forecasts are from the 00Z 15 Jul 2026 GFS ensemble.
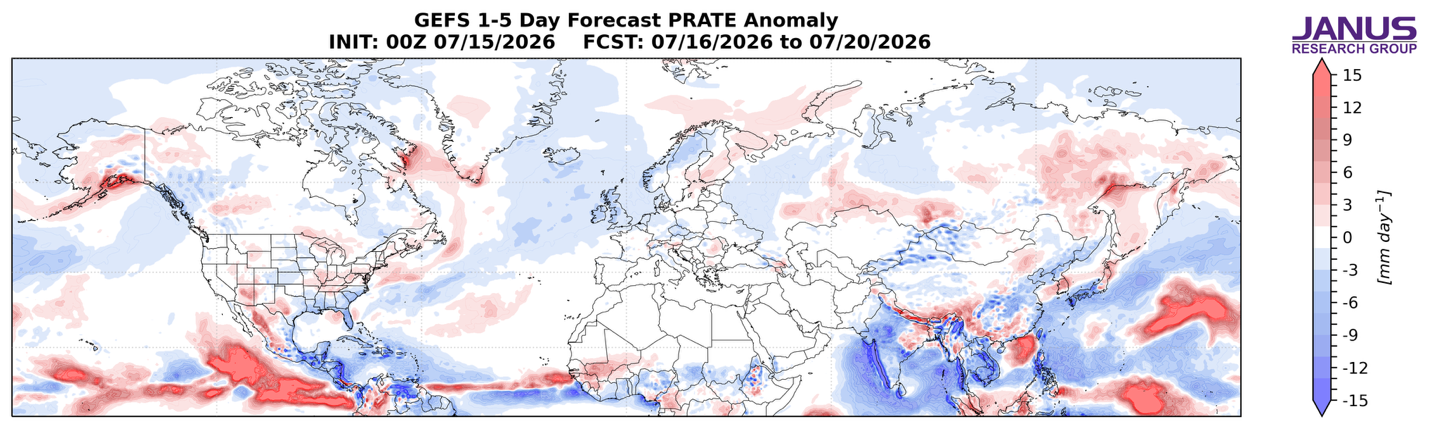
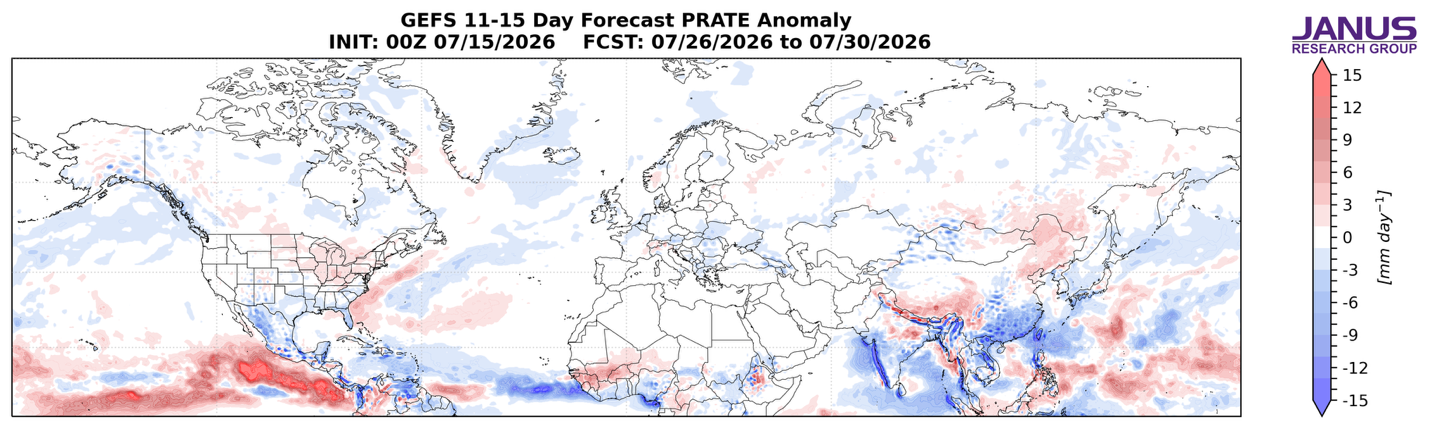
Troughing will support new rainfall across eastern Scandinavia, the Southern Urals, Eastern Siberia and the Tibetan Plateau with mostly dry conditions across much of Europe and Asia (Figure 4). Troughing will support new rainfall across Alaska, the Canadian Rockies, Central Canada, the US Southern Rockies, the Upper Midwest and the southern Great Lakes with mostly dry conditions across much of North America this week (Figure 4).
Figure 4.
Forecasted precipitation (mm/day; shading) from 16 Jul 2026 to 20 Jul 2026. The forecasts are from the 00Z 15 Jul 2026 GFS ensemble.
Near-Mid Term
Next Week
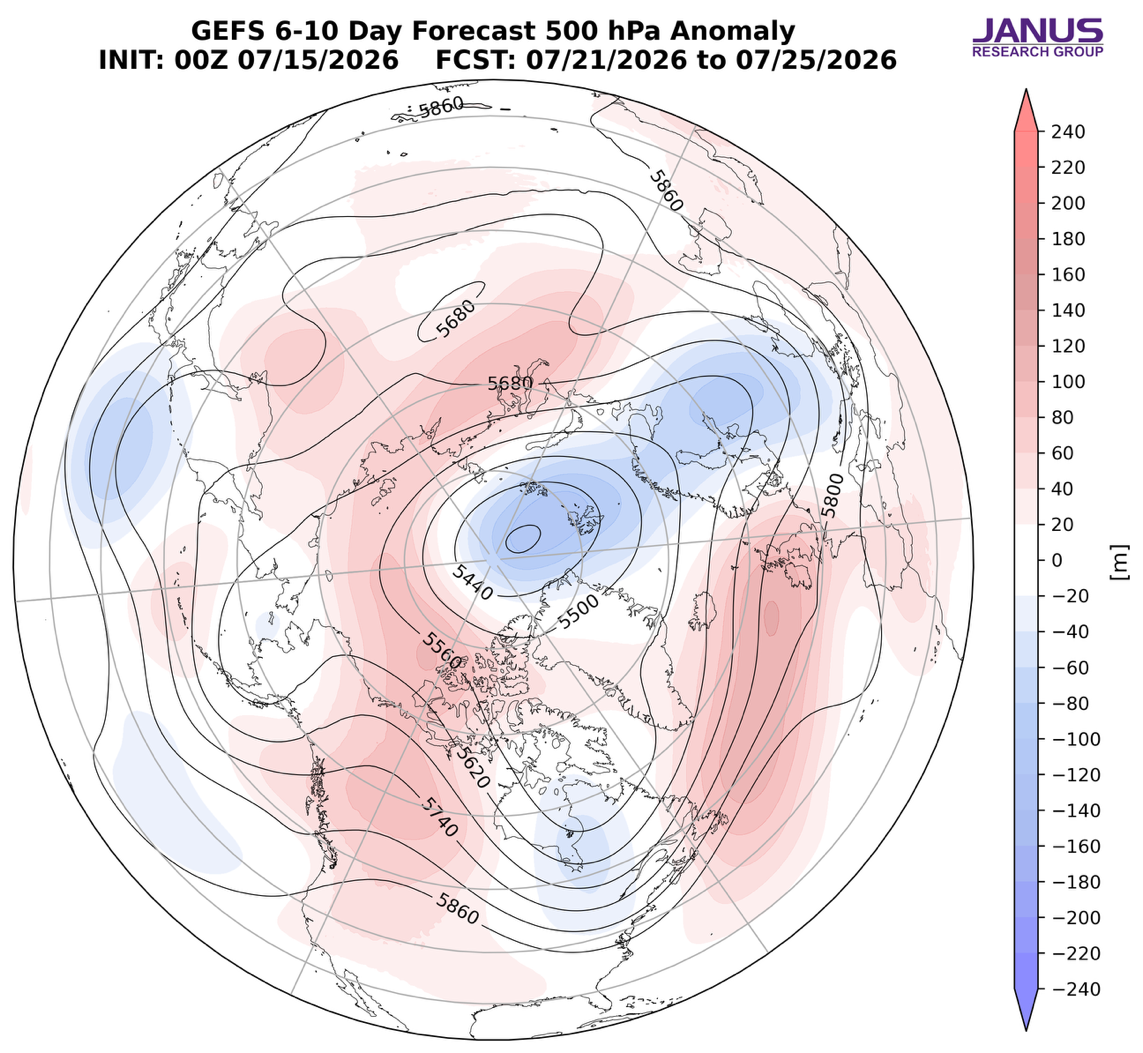
With geopotential height anomalies remaining mostly mixed to positive across the Arctic and with mixed geopotential height anomalies across the mid-latitudes this period (Figure 5), the AO will likely be negative to neutral this period (Figure 1). With mostly positive pressure/geopotential height anomalies across Greenland (Figure 5), the NAO will likely be negative this period.
Figure 5.
Forecasted average 500 mb geopotential heights (dam; contours) and geopotential height anomalies (m; shading) across the Northern Hemisphere from 21 July 2026 to 25 July 2026. The forecasts are from the 00Z 15 Jun 2026 GFS ensemble.
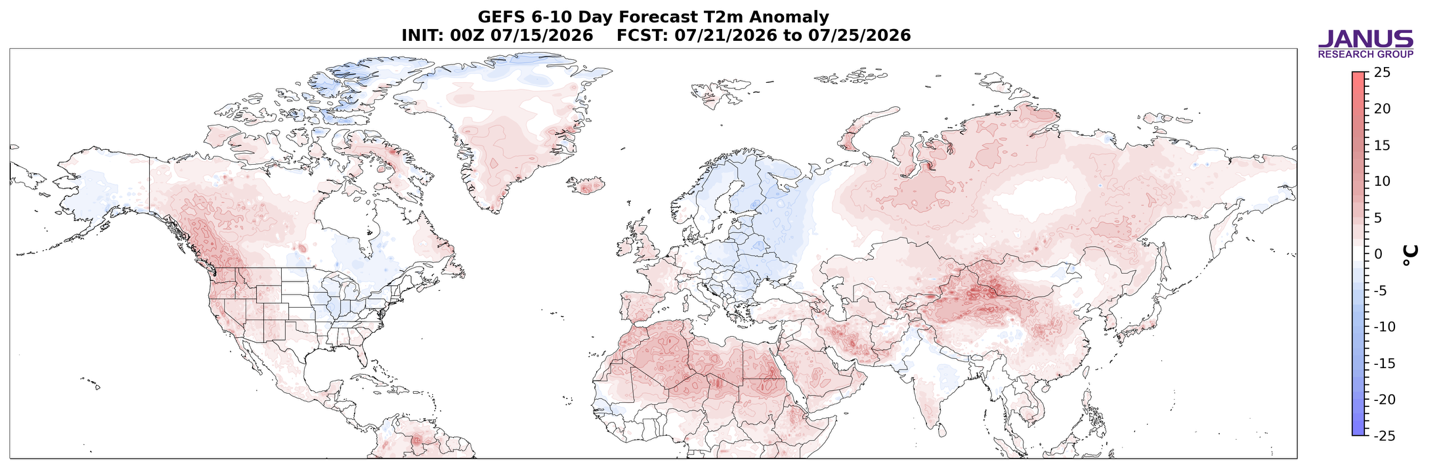
Ridging/positive geopotential height anomalies across Greenland will continue to support troughing/negative geopotential height anomalies across Eastern Europe while ridging mostly persists across Western Europe this period (Figure 5). The pattern will support normal to above normal temperatures across Western Europe including the UK with normal to below temperatures across Central and especially Eastern Europe this period (Figure 6). Ridging/positive geopotential height anomalies are predicted to return to near the Urals supporting weak troughing/negative geopotential height anomalies across Southern Siberia this period (Figure 5). This pattern favors widespread normal to above normal temperatures widespread across Asia but especially Central Asia with normal to below normal temperatures across far Western Russia and parts of Northeast Asia this period (Figure 6).
Figure 6.
Forecasted surface temperature anomalies (°C; shading) from 21 July 2026 to 25 July 2026. The forecasts are from the 00Z 15 July 2026 GFS ensemble.
Across North America ridging/positive geopotential height anomalies will continue to strengthen across western North America with deepening troughing/negative geopotential height anomalies across eastern North America this period (Figure 5). This pattern will favor normal to above normal temperatures across Western Canada and the Western US with normal to below normal temperatures across Alaska, Eastern Canada and the Eastern US this period (Figure 6).
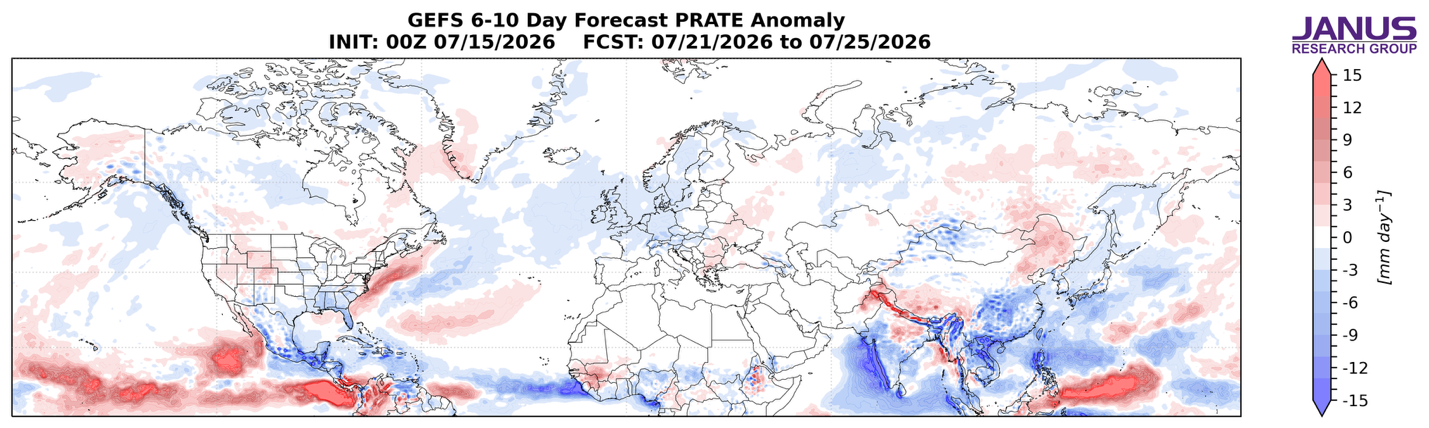
Figure 7.
Forecasted rainfall rate (mm/day; shading) from 21 July 2026 to 25 July 2026. The forecasts are from the 00Z 15 July 2026 GFS ensemble.
Troughing will support new rainfall across Southeastern Europe, Siberia, Northeastern China, Southwestern China and the Tibetan Plateau with mostly dry conditions across much of Europe and Asia (Figure 7). Troughing will support new rainfall across Alaska, Southwestern Canada and the US Rockies with mostly dry conditions across much of North America this week (Figure 7).
Mid Term
Week Two
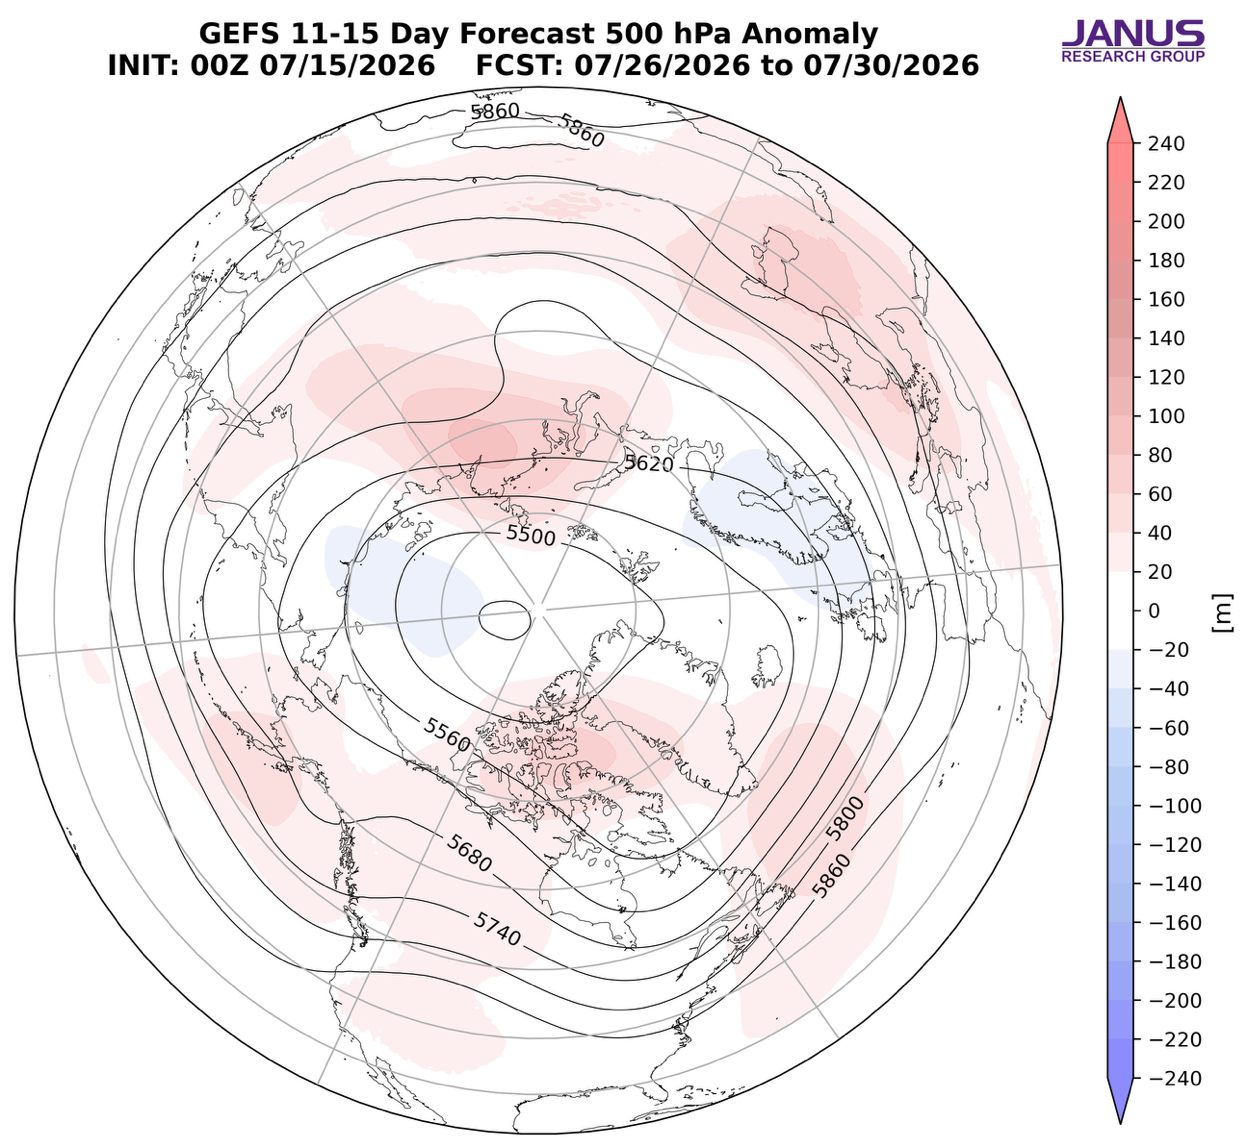
With predicted mostly mixed to positive geopotential height anomalies across the Arctic and mixed geopotential height anomalies across the mid-latitudes this period (Figure 8), the AO will likely remain neutral to negative his period (Figure 1). With predicted weak but positive pressure/geopotential height anomalies across Greenland (Figure 8), the NAO will likely remain negative to neutral this period.
Figure 8.
Forecasted average 500 mb geopotential heights (dam; contours) and geopotential height anomalies (m; shading) across the Northern Hemisphere from 26 July to 30 July 2026. The forecasts are from the 00Z 15 July 2026 GFS ensemble.
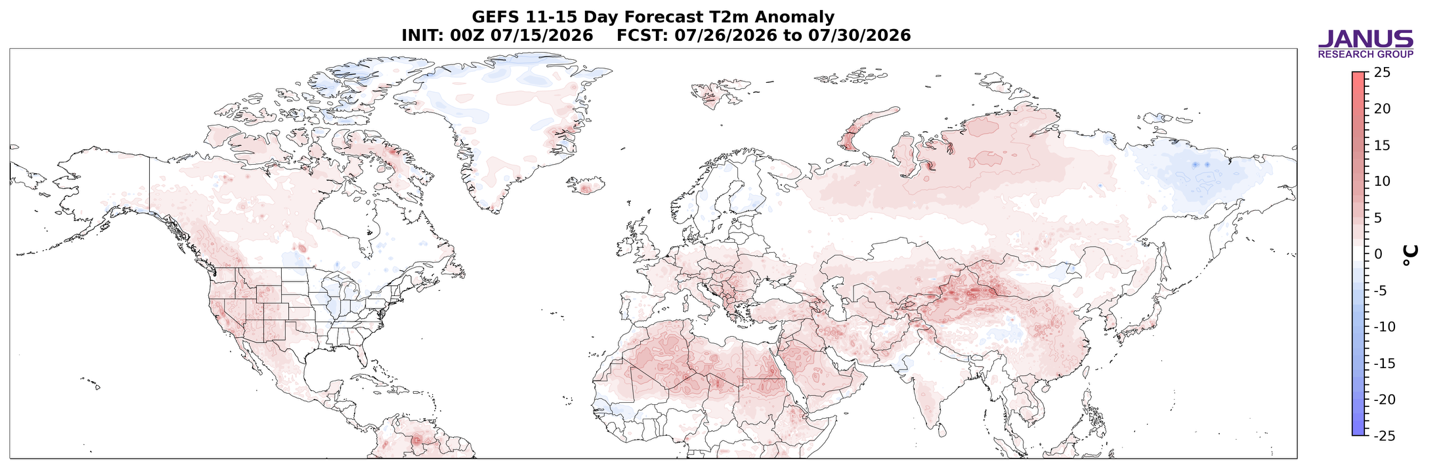
Ridging/positive geopotential height anomalies is predicted to persist but weaken across Greenland supporting only weak troughing/negative geopotential height anomalies persisting across Northern Europe with ridging across Southern Europe this period (Figure 8). This pattern will favor widespread normal to above normal temperatures across much of Europe including the UK except for normal to below normal temperatures across Scandinavia and the Baltic States this period (Figures 9). The persistent ridging/positive geopotential height anomalies centered over the Urals are predicted to expand into Western Siberia with the main troughing/negative geopotential height anomalies across Eastern this period (Figure 8). This pattern favors widespread normal to above normal temperatures across most of Asia especially Northern Siberia and Central Asia with normal to below normal temperatures limited to Eastern Siberia this period (Figure 9).
Figure 9.
Forecasted surface temperature anomalies (°C; shading) from 26 July to 30 July 2026. The forecasts are from the 00Z 15 July 2026 GFS ensemble
Ridging/positive geopotential height anomalies are predicted to persist over western North America supporting the continuation of troughing/negative geopotential height anomalies across Eastern Canada and the Eastern US this period (Figure 8). This pattern supports normal to above normal temperatures across Western Canada and the Western US with normal to below normal temperatures across Alaska, Eastern Canada and the Eastern US this period (Figure 9).
Figure 10.
Forecasted rainfall (mm/day; shading) from 26 July to 30 July 2026. The forecasts are from the 00Z 15 July 2026 GFS ensemble
Troughing will support new rainfall across the Alps, Southern and Eastern Siberia, Northeast Asia, the Tibetan Plateau and into southwest China with mostly dry conditions across much of Europe and Asia (Figure 10). Troughing will support new rainfall across Alaska, Western Canada, the US Northern Plains and the Great Lakes with mostly dry conditions across much of North America this week (Figure 10).
Longer Term
30-day
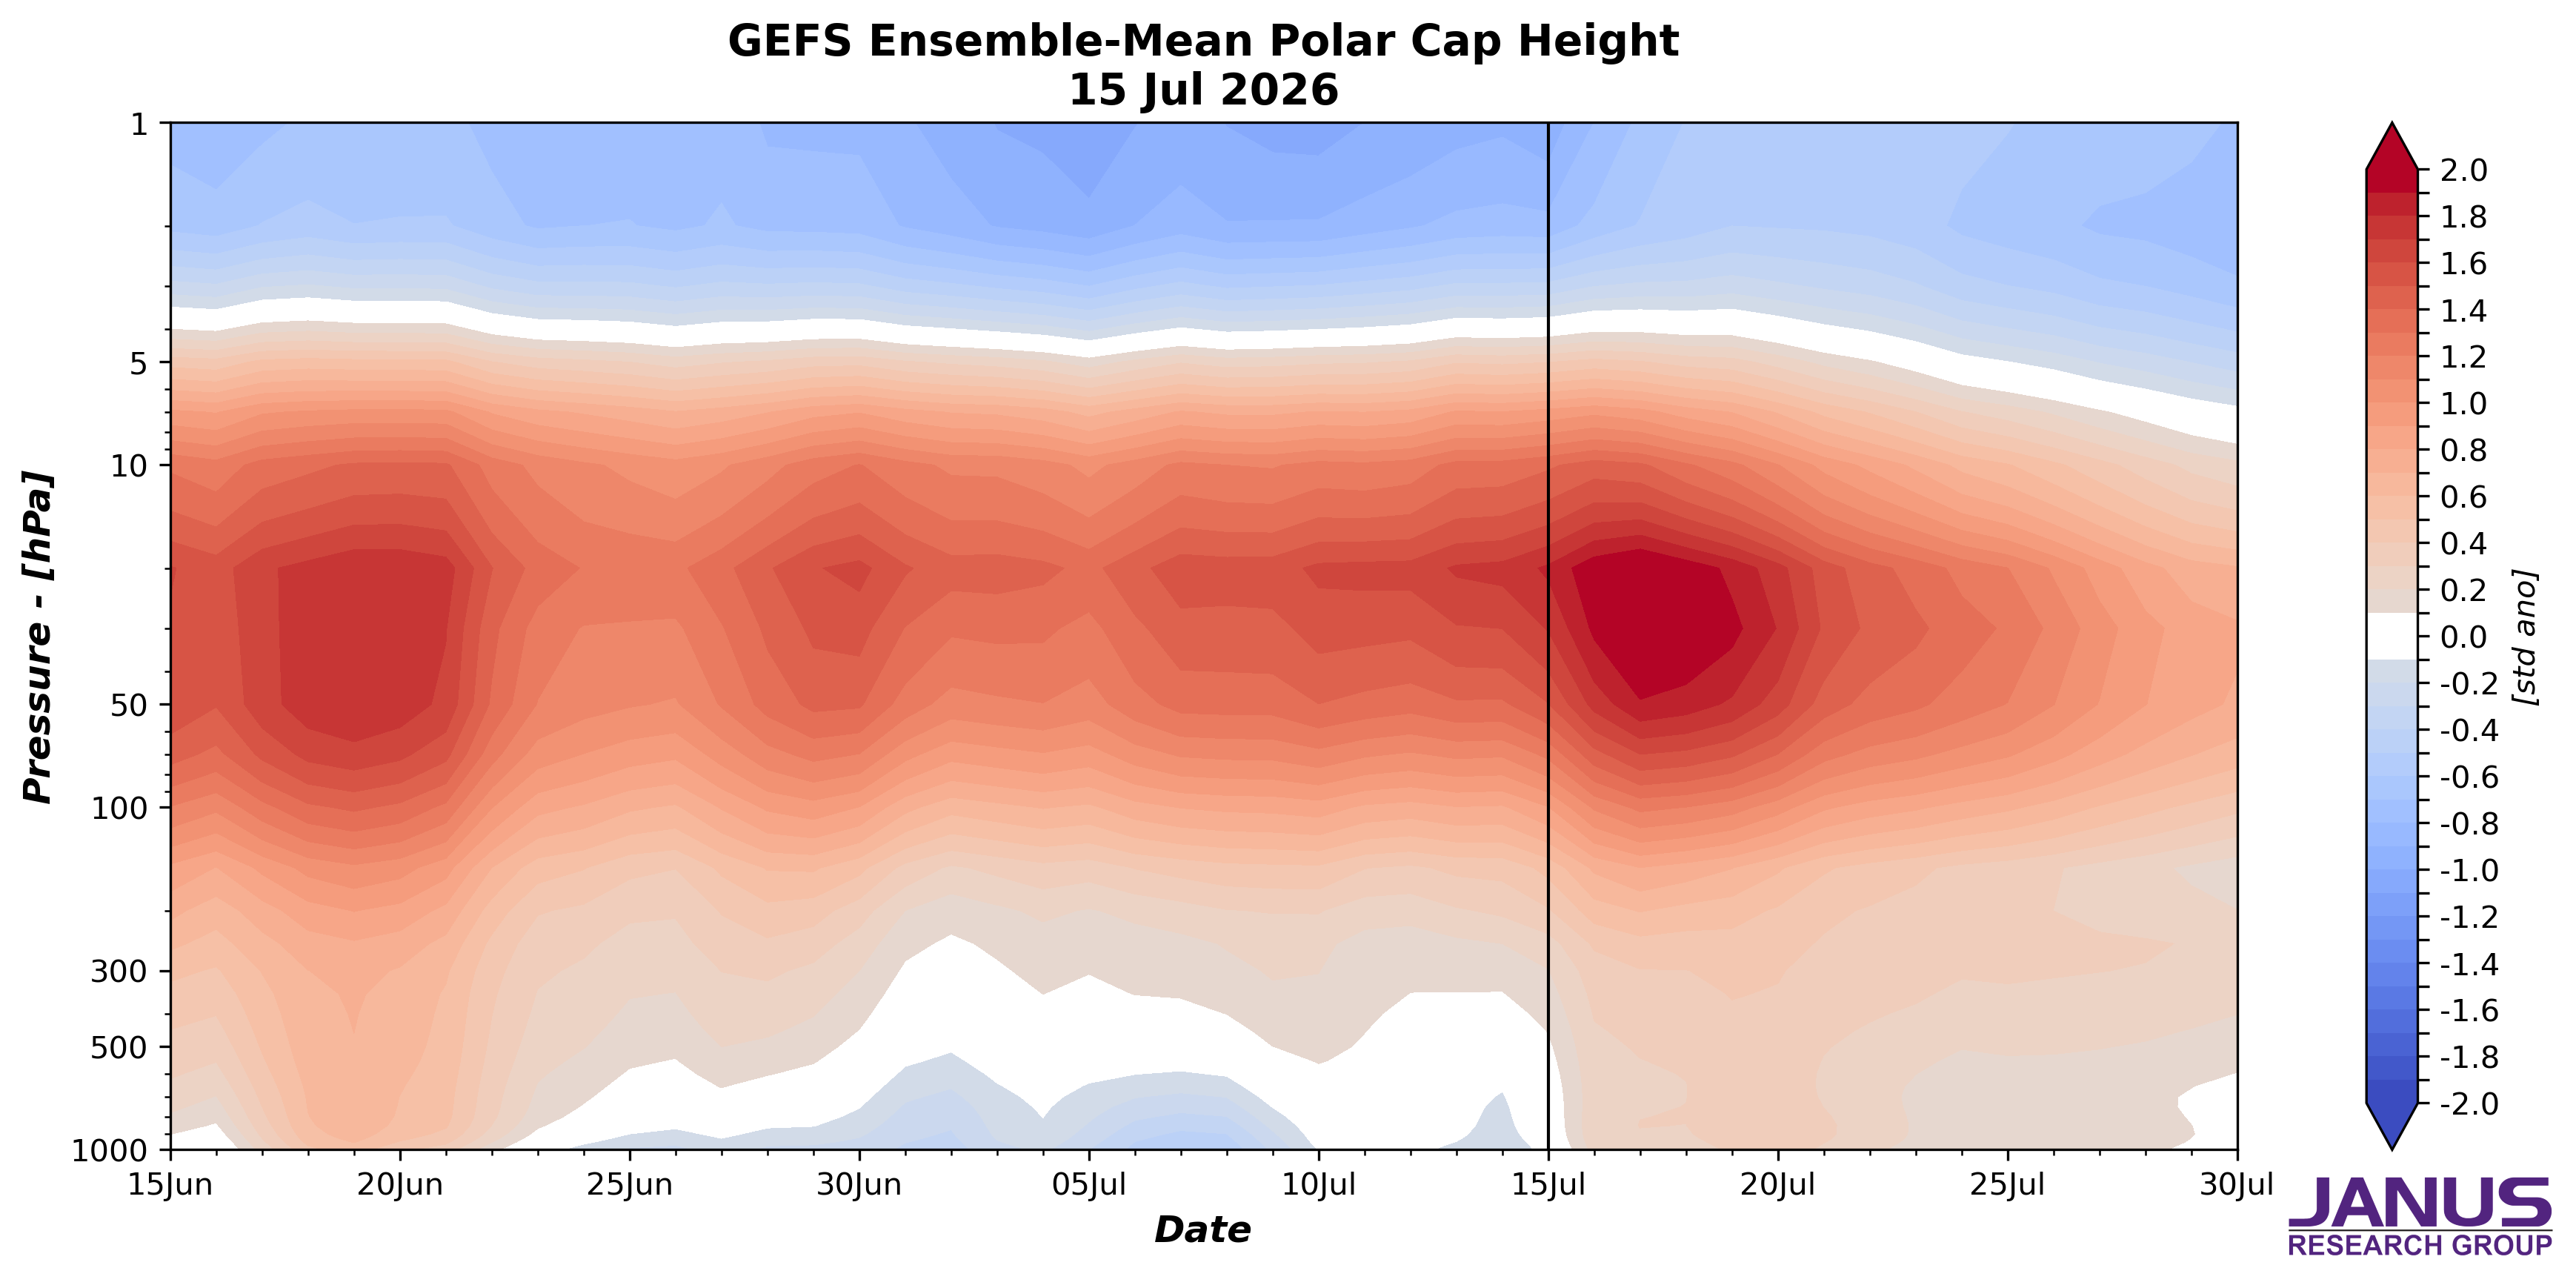
Today’s polar cap geopotential height anomalies (PCHs) plot currently shows cold/negative PCHs in the upper stratosphere and the lower troposphere with warm/positive warm/positive PCHs in the lower stratosphere and the mid to upper troposphere (Figure 11). However almost immediately this week, the warm/positive PCHs extend downward into the lower troposphere.
Figure 11.
Observed and predicted daily polar cap height (i.e., area-averaged geopotential heights poleward of 60°N) standardized anomalies. The forecast is from the 00Z 15 Jul 2026 GFS ensemble.
The next two weeks the predicted weak but warm/positive PCHs in the lower troposphere (Figure 11) are consistent with the predicted neutral to negative surface AO (Figure 1).
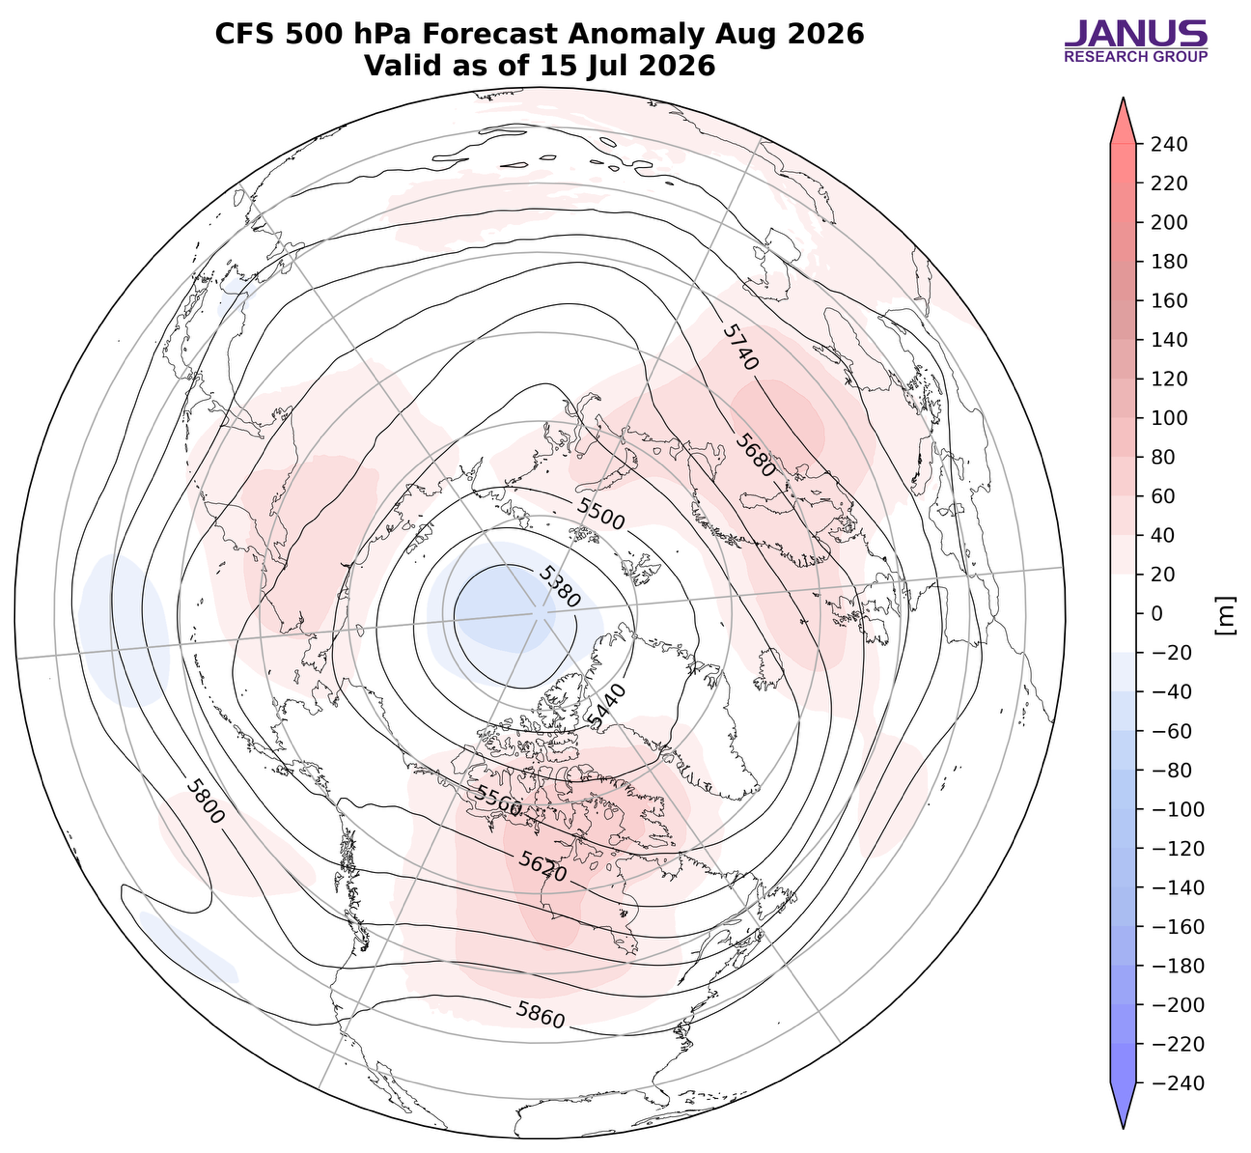
Figure 12.
Forecasted average 500 mb geopotential heights (dam; contours) and geopotential height anomalies (m; shading) across the Northern Hemisphere for Aug 2026. The forecasts are from the 00Z 15 July 2025 CFS.
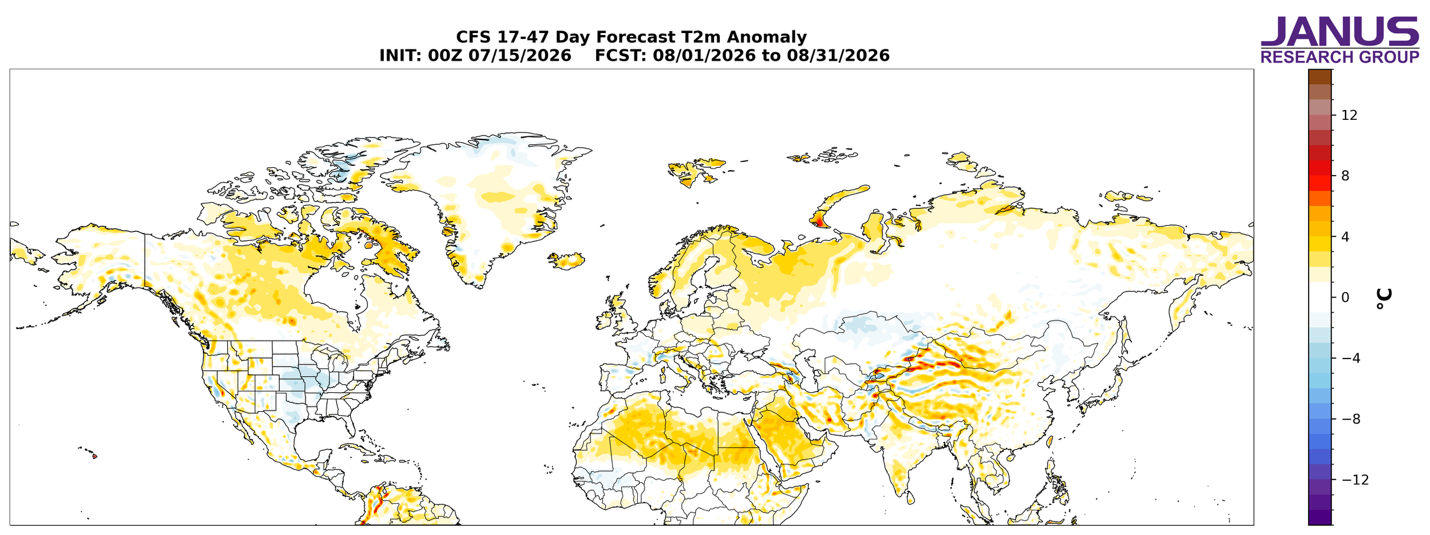
I include in this week’s blog the monthly 500 hPa geopotential heights (Figure 12) and surface temperatures for August (Figure 13) from the Climate Forecast System (CFS; the plots represent yesterday’s four ensemble members). I do want to emphasize unless I say otherwise, I find the CFS forecasts of low confidence and most often don’t match my own thinking. The forecast for the troposphere is ridging across Eastern Europe, Eastern Siberia and Hudson Bay with troughing across the Iberian Peninsula, Western Siberia, the Dateline, the US West Coast, Eastern Canada and the Northeastern US (Figure 12). This pattern favors seasonable to relatively warm temperatures across Eastern Europe, much of Asia including the Middle East, the Tibetan Plateau, Pakistan and Afghanistan, Alaska, Western and Northern Canada and the Western US with seasonable to relatively cool temperatures across Western Europe, Southwestern Russia and into northern Kazakhstan, Northeast Asia, Southeastern Canada and the Central US (Figure 13).
Figure 13.
Forecasted average surface temperature anomalies (°C; shading) across the Northern Hemisphere for Aug 2026. The forecasts are from the 00Z 15 Jul 2026 CFS.
Boundary Forcings
SSTs/El Niño/Southern Oscillation
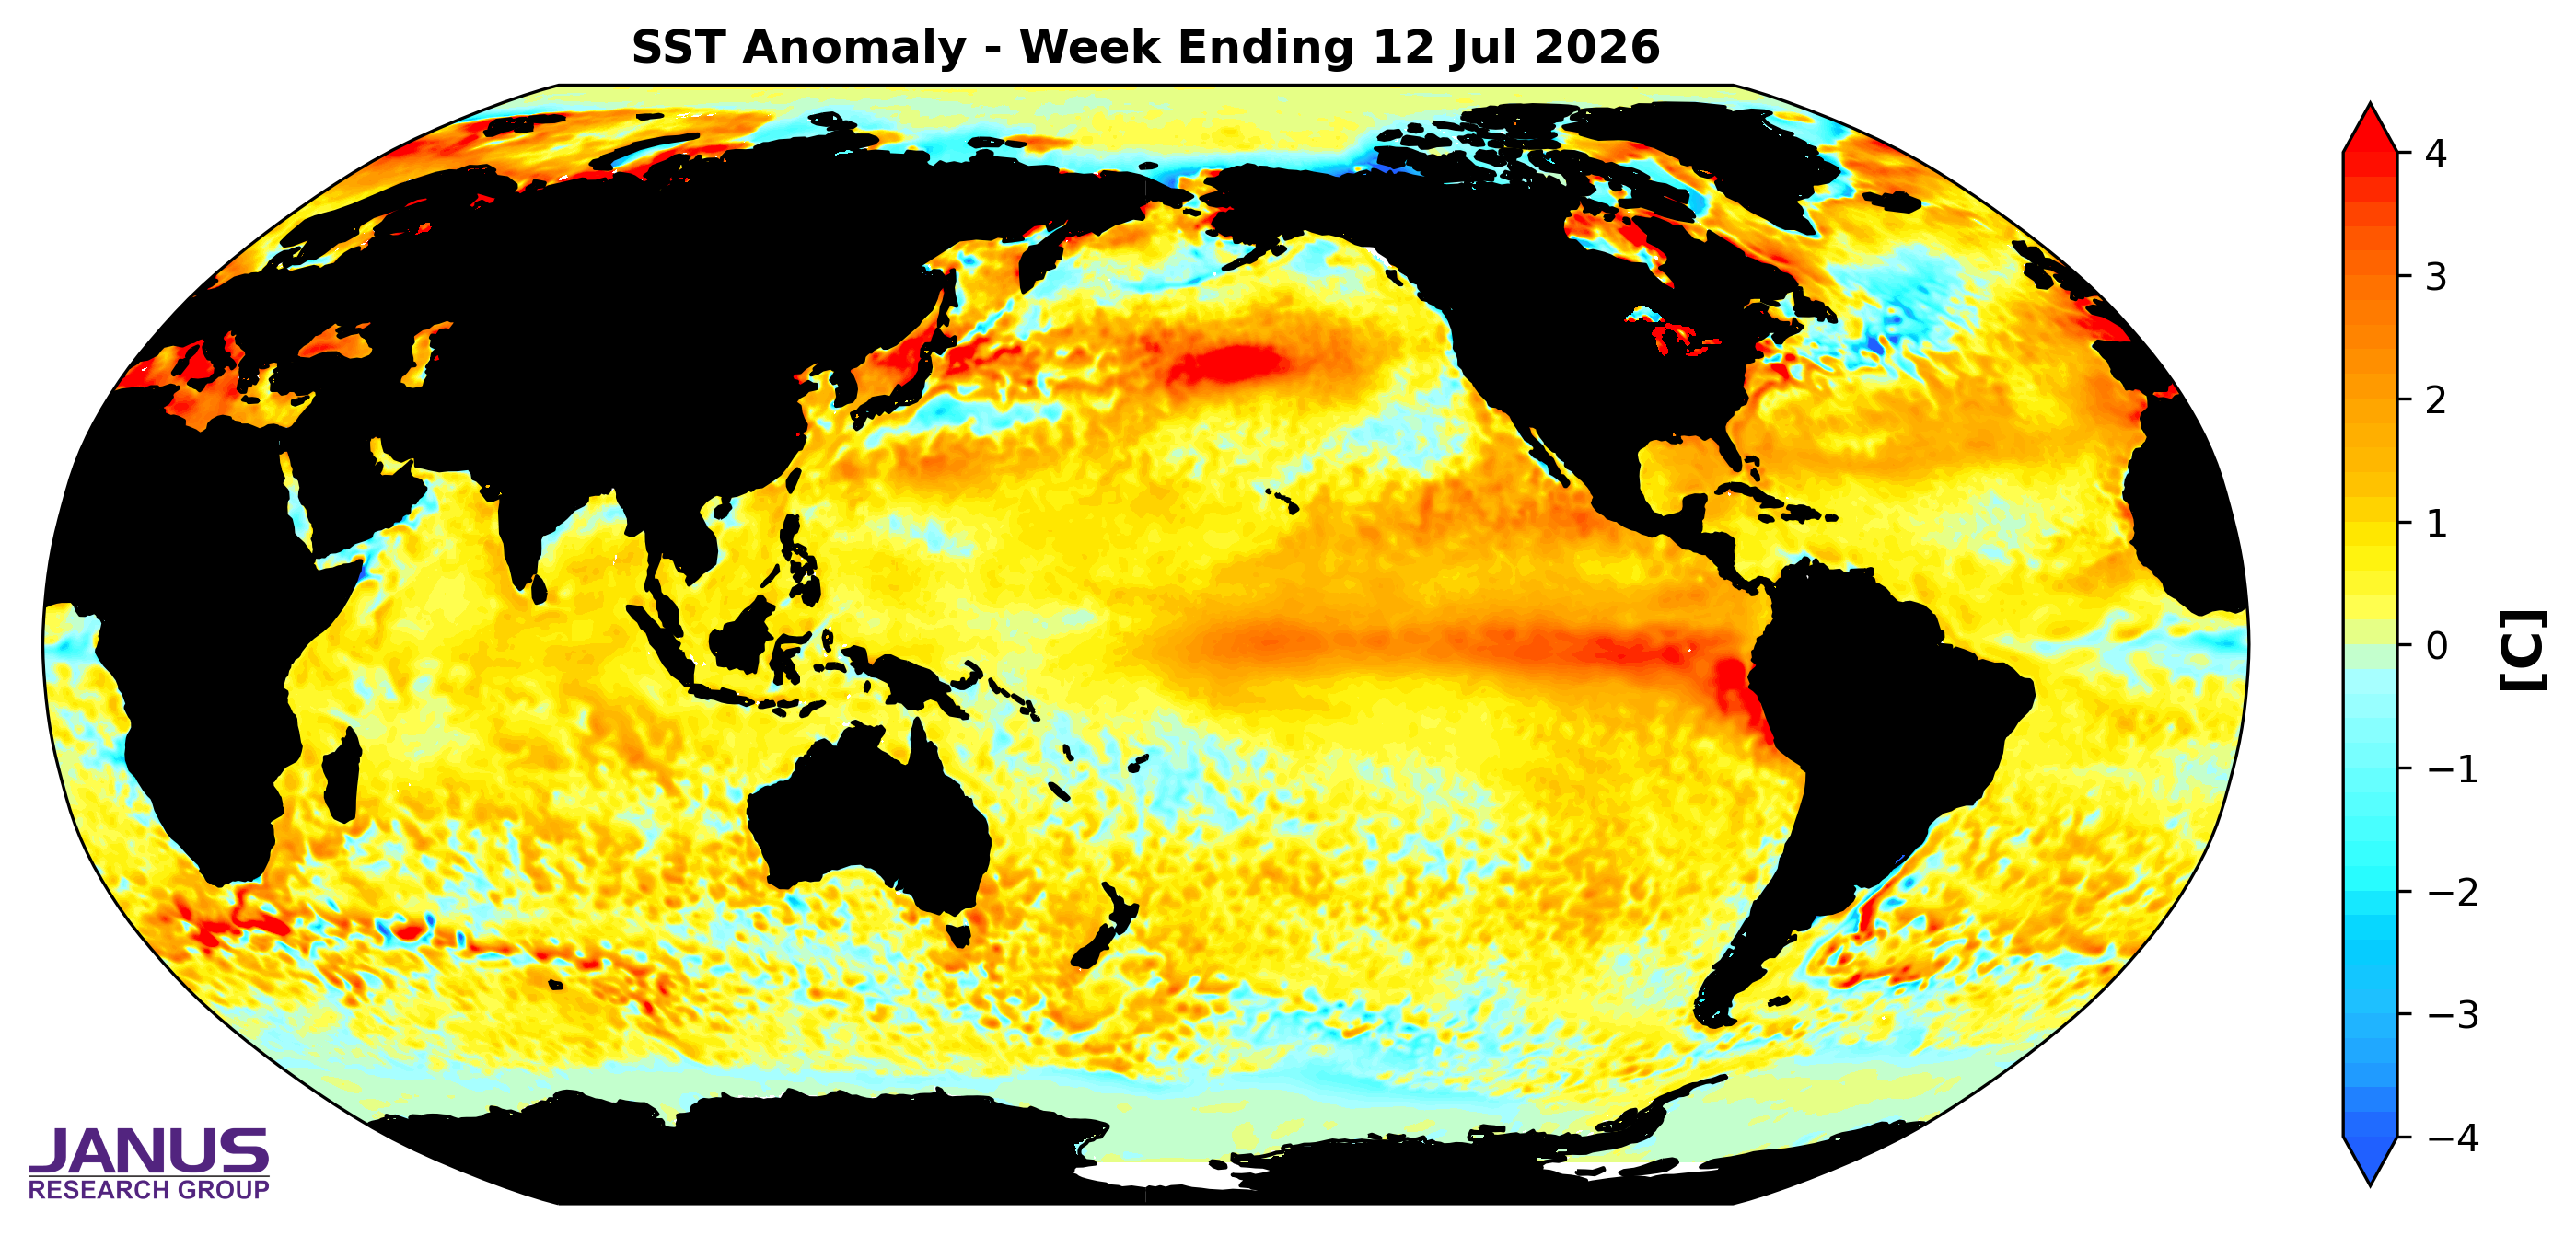
Equatorial Central Pacific sea surface temperatures (SSTs) anomalies are above normal, with the warming focused along the South American coast and out to the Dateline (see Figure 14), clear signs of El Niño conditions. In fact a possible “super” El Niño this fall and winter has been receiving much attention in the media. Observed SSTs across the NH remain well above normal especially in the North Pacific and much of the North Atlantic especially near Europe, though below normal SSTs exist regionally especially in the Southern Ocean and in the western North Atlantic.
Figure 14.
The latest daily-mean global SST anomalies for week ending 12 Jul 2026.
Madden Julian Oscillation
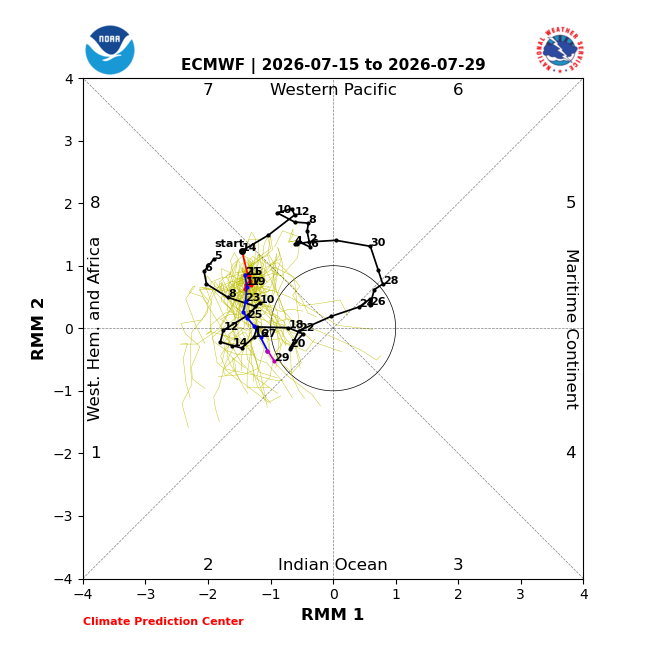
Currently the Madden Julian Oscillation (MJO) is in phase eight (Figure 15), and the forecasts are for the MJO to move into phase one while weakening the next two weeks (Figure 15). Phase eight favors ridging across Canada with troughing across the Western US while phase one favors troughing in Western Canada with ridging in the Eastern US inconsistent with forecasts starting next week and into the following week. Therefore it seems that the MJO is having little influence on North American weather for the reminder of July. But admittedly this is outside of my expertise.
Figure 15.
Past and forecast values of the MJO index. Forecast values from the 00Z 15 Jul 2026 ECMWF model. Yellow lines indicate individual ensemble-member forecasts, with the green line showing the ensemble-mean. A measure of the model 'spread' is denoted by the gray shading. Sector numbers indicate the phase of the MJO, with geographical labels indicating where anomalous convection occurs during that phase. Image source https://www.cpc.ncep.noaa.gov/products/precip/CWlink/MJO/CLIVAR/ecmf.shtml